GA4 and beyond for better business benchmarking
- Jun 11, 2025
- 11 min read
Author: James Clark

When Google launched the latest version of its analytics tool, Google Analytics 4, back in 2020, it was missing several features that longstanding Google Analytics users relied on. Since then, Google has been adding these features back into GA4: 2022 gave us bounce rate, 2023 brought scheduled email reports, and, in 2024, it was the return of benchmarking.
In this article, I’ll show you how to use GA4’s benchmarking feature—both from a technical and (more importantly) a business perspective. I’ll also suggest some alternatives to GA4 in case Google Analytics doesn’t meet your benchmarking requirements.
Table of contents:

What is benchmarking?
Benchmarking is a form of comparison for website, campaign, or business performance. In Google’s words, you “compare your business performance against the performance of other businesses in your industry.”
In my role as a freelance analyst, my clients often ask me how well their site is performing. To answer that question, I look at relevant metrics. For example, if the client’s focus is content engagement, I might consider time on page, bounce rate, and so on. But, let’s say the site’s bounce rate is 40%—is that cause for concern, or celebration?
There are different ways of answering this question, all of which involve making some sort of comparison. For example, you could look at change over time (say, by comparing this year to last year). If the bounce rate was 50% last year, but 40% this year, that suggests a positive change.

You could also compare one part of the site against another. If your how-to guides have a bounce rate of 20% against a site average of 30%, that suggests the section is performing well.
Benchmarking against other businesses is just another form of comparison. If your bounce rate is 40%, but similar businesses have an average bounce rate of 20%, that suggests you are doing something different. You should look into that to make sure there isn’t an issue with your content, site performance, or tracking.
Benchmarking can also provide insight into industry or seasonal trends. If your bounce rate spikes in the lead up to Christmas, it can be reassuring to know that your peers are experiencing the same.
Benchmarking in GA4: What you need to know
Google is in a great position to offer benchmarking because GA4’s user base is so large. Even if you’re operating in a niche industry, many other businesses in that niche are likely using GA4. Google can aggregate the analytics data from those businesses to provide useful and anonymized benchmarking data.
Before you start benchmarking
To use benchmarking in GA4, you must first enable it by ticking the “Modelling contributions & business insights” box in Admin > Account Details:

This is a ‘give and get’ arrangement—you can only use the benchmarking feature if you agree to contribute your own data to it as well. And, as this option is at the account level, you can’t choose to share data from certain properties in the account but not others.
I recommend that you select an industry category for your property (under Admin > Property Details). If you didn’t do this on initial setup, the field will say “Select one”:

Although you don’t need to select an industry category to use benchmarking, it’s one of the signals that Google uses to set your default “benchmarking peer group” (i.e., the group of websites you’ll compare yours against).
Where to find benchmarking in GA4
Benchmarking in GA4 doesn’t have its own dedicated report. Instead, it’s only available on the “Overview” card on the homepage. This is the card that consists of a trendline with a number of ‘score cards’ above it, each of them displaying a single metric.

You can only view benchmarking data for one metric at a time. Here’s how:
Click on one of the score cards so that it is highlighted in blue.
Click on the ‘medal’ icon in the top-right of the Overview card (highlighted in yellow above).
If benchmarking data is available for this metric, you’ll see a slider to turn it on.
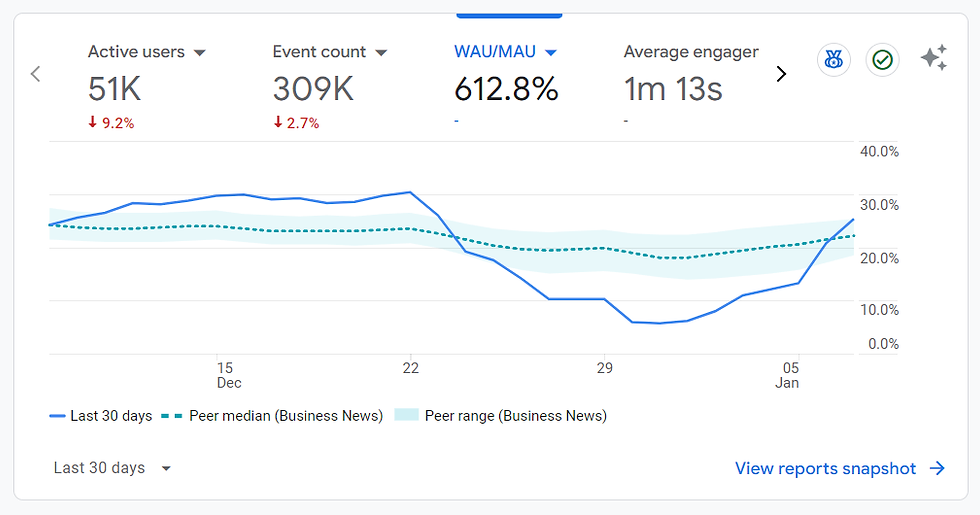
Once you’ve enabled benchmarking for a specific metric, the trendline will change to include two new elements:
The green dotted line shows the median average figure for businesses in the benchmarking group.
The shaded section shows the “peer range” from the 25th to the 75th percentile. In other words, if you fall above this range, you’re in the top quarter of businesses in your peer group for this metric; if you fall below this range, you’re in the bottom quarter.

Historic benchmarking data is available immediately; this isn’t like Google Search Console, where you need to wait for data to appear after verifying your site. However, this historic data only goes back to May 30, 2024 (or more recently, for some properties).
Choose a time frame using the picker to the bottom-left of the trendline. If your date range includes the current date, or covers a period of 60 days or more, you won’t see any benchmarking data.
How to set and change your peer group
When you clicked the medal icon to enable benchmarking, you may have noticed that the panel here also lists your benchmarking peer group. Google selects this group based on a number of signals:
Your industry category (if you’ve chosen one)
Your URL
Your GA4 property attributes
I’ve seen properties with a peer group of “none selected,” so perhaps Google doesn’t always have enough data to work with.
Whether Google has set your peer group or not, you’re always free to select your own. The first level of the peer group taxonomy is the same as Google’s industry category taxonomy, but then it goes into greater detail (up to three further levels):

Some of the peer groups appear in more than one category: for example, “Sports News” appears under both “Sports” and “News.” Where that happens, it doesn’t matter how you select the peer group as long as it’s the right one for your business.
In addition to browsing the taxonomy, you can use the search box at the top of the panel to look for particular terms. Try a few different synonyms—“recruitment” and “career” as well as “job,” for example—to make sure you see all the relevant results.
Metrics available for benchmarking
Benchmarking is only available for some of GA4’s metrics. Broadly speaking, these are metrics that indicate performance per session or per user. So, that could relate to engagement (e.g., “average session duration”), eCommerce (“add to carts per active user”), or revenue (“average revenue per user”).
Metrics that indicate the overall size of your audience or business, such as new users or total purchasers, aren’t available for benchmarking. Any custom metrics you’ve created can’t be used for benchmarking either.
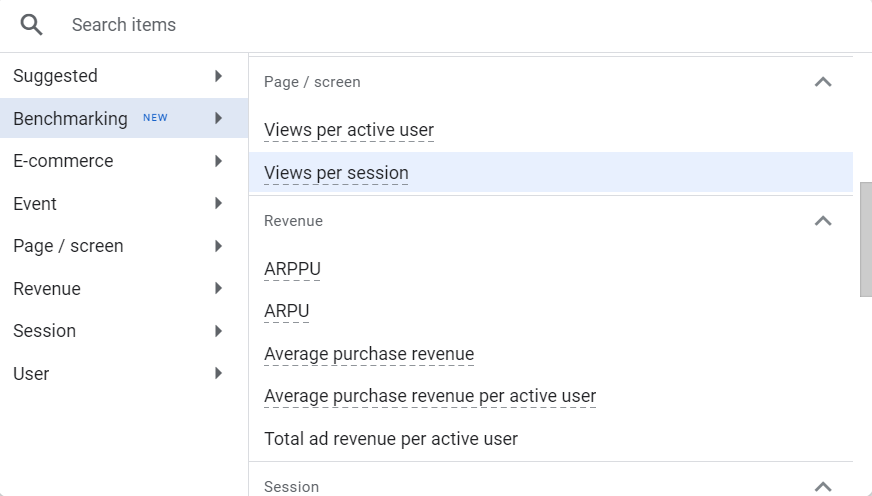
You can freely change the metric shown in any of the scorecards by clicking on the down arrow alongside the metric name.
This opens a panel detailing all available metrics. The metrics are divided into categories on the left, with one of those categories listing all the metrics that work with GA4’s benchmarking feature:
Troubleshooting: Why can’t I see any data?
If you aren’t seeing any benchmarking data, check the following:
You’ve enabled “Modelling contributions & business insights” in your Account Details.
You’ve clicked the medal icon and turned “Benchmarking data on.”
You’ve selected a metric from the “benchmarking” category.
You’ve selected a time frame that doesn’t include today.
You’ve selected a time frame that is less than 60 days.
You’re looking at data after May 30, 2024.
A benchmarking peer group is set for your property.
What about traffic levels? You might think that low-traffic sites wouldn’t be able to use the benchmarking feature. After all, Google says “properties must also have a minimum volume of users and be generating a minimum volume of meaningful data in order to be included in a peer group and contribute to its benchmarking metrics.”
However, I’ve seen properties with “no data received from your website yet” that have benchmarking working. So it looks like you can use benchmarking even if your traffic is too small for you to contribute your own data.
How to benchmark for maximum impact
Now that you know how to use benchmarking in GA4, let’s look at how to use it effectively for your business. Here are my three top tips:
Focus on the right metrics
Select your peer group wisely
Understand the limitations of benchmarking
Focus on the right metrics
Start with your business goals and work backwards from there to identify relevant key metrics. I often work with B2B publishers, where the target audiences are niche and subscriptions are high-value, so retention is vital. A metric such as “WAU/MAU” (showing the proportion of monthly users who are active on a weekly basis) is a great choice here.
You can interpret most metrics in more than one way. If your site has low “views per session,” it could mean that users are finding the content irrelevant so they are clicking straight out. Or, it could mean that the content is so perfectly meeting their search intent that they have no need to view more than one page on your site.
That’s why you should never look at a single metric in isolation. To put the low views per session into context, for example, you could also consider “average engagement time per session.”
Select your peer group wisely
Be as specific as you can when choosing a peer group. If you run a sports news and results website, you could select “Sports” or “News,” but you’re better off benchmarking against “Sports News” or even “Sports Scores & Statistics.”
If your peer group is too broad, you’ll compare yourself against businesses that are quite different from yours and possibly make harmful business decisions as a result.
Consider business type as well as topic: Are the other businesses in a peer group likely to be similar to yours? If you run a news website about infosec, you might be tempted to select the “Computer Security” peer group. But, that group will contain businesses that offer security services. Instead, you might consider “Technology News” so you can benchmark against other news sites.
There’s another benefit to choosing the right peer group—an altruistic one. By opting into benchmarking, you agree to contribute your own site data to Google’s benchmarking metrics. Google hasn’t confirmed this, but I assume that your data counts towards whichever peer group you select. So by taking the time to select the most relevant peer group, you’re making the feature more useful for other GA4 users.
Understand the limitations of benchmarking
Industry sector isn’t the only criteria by which you should identify your peers. Business size is also important. For example, take the category “Pizzerias.” This might contain businesses ranging from single family restaurants to multinational chains. If you run a family pizza restaurant, you wouldn’t consider a multinational chain to be a ‘peer.’
It’s unclear whether GA4 takes business size into account when benchmarking. There isn’t an option within benchmarking itself to set this, but it is data you would have given Google when originally creating the property:

And, as I’ve seen two different properties in the same benchmarking peer group give different benchmarking figures, I suspect Google does take business size or other hidden factors into account.
However, there’s no way to change your business size in GA4 after you’ve created the property. So if this does play a role in benchmarking, and your business has grown since you created the property, you may find yourself compared against businesses of the wrong size.
Also, some of GA4’s metrics tell you more about analytics implementation than business performance. For example, if your “events per session” is lower than your peers, is this because your users are less engaged or because you are tracking fewer events on your site? Your tag settings will also have an impact (e.g., reducing your session timeout could increase your “sessions per active user”).
When it comes to benchmarking, either using GA4 or elsewhere, remember Goodhart’s law: “When a measure becomes a target, it ceases to be a good measure.” Avoid the temptation to ‘game the system’ to boost individual metrics, as this won’t help your business.
Alternatives to benchmarking in GA4
If you feel benchmarking would be useful for your business, but limitations with GA4 are holding you back, there are other approaches you can consider, including:
Third-party tools
Wix Analytics Benchmarks
Industry reports
Creating your own benchmarking group
Use third-party tools
GA4 benchmarking only uses GA4 data. This means you can benchmark effectively in some areas, such as engagement or eCommerce, but not in others, such as SEO or social performance.
A third-party tool that works with a range of data sources widens your benchmarking capabilities. An example is Benchmark Groups from Databox, which pulls in data from a range of Google sources (GA4, Search Console, Google Ads) as well as non-Google sources (Facebook, LinkedIn, HubSpot, and so on):

Use Wix Analytics Benchmarks
If your site is built with Wix, you have access to Wix Analytics Benchmarks right in your Wix dashboard. To get started, go to Analytics > Benchmarks.
Like Google, Wix is in an excellent position for benchmarking data because so many sites use the platform. And, similar to Google, Wix sets a default category for your site and lets you change this at any time.

Wix takes a different approach to displaying its benchmarking data, summarizing the key results rather than only allowing you to view one metric at a time. It also recommends specific actions you can take to improve your site performance.
Use industry reports
With a little desk research, you may be able to unearth an industry report or study containing benchmarking data. Platforms or agencies will publish these reports to position themselves as experts in a particular field and attract inbound links.
For example, the Oniva event platform has shared benchmarks for events carried out on its platform, with metrics including event invitation open rate and response rate.
These reports often include first-party data that can’t be found anywhere else. On the downside, reports age quickly and are unlikely to be updated more than once a year (if at all).
Create your own benchmarking group
You can also create your own benchmarking group(s), which you might be well positioned to do if you work with multiple clients in the same sector.
In this scenario, you could create your own benchmarks by aggregating your clients’ data with respect to both business type and business size. The more businesses you include in your benchmarking group, the more robust your benchmarks will be. Your clients may be perfectly happy to be included in the group in return for access to the benchmarking figures.
The advantage of this approach is the transparency and control it gives you; the disadvantage is the time you need to set up the group and generate the benchmarks.
Benchmarking: Because competition is an ongoing process
I seem to end most of my Wix SEO Learning Hub articles by saying that analytics should be an ongoing process, not a one-off exercise. Benchmarking is no exception!
Set yourself a schedule to review your benchmarking data regularly. Monthly might be a good interval here—if you check too often, you’ll find yourself reacting to every blip. And, while it’s important to be consistent with your approach, peer group, and choice of metrics, review these occasionally as well to make sure they are still relevant to your business.
Above all, benchmarking data is meant to be actionable; it generates insights that prompt you to take action. Google’s Analytics Help site has some great example scenarios here.
Once you’ve taken action, benchmarking also enables you to observe the impact of the action, decide on your next course of action, and act again. This virtuous circle is called the “action research cycle.”

As long as you keep the focus on improving business performance rather than individual metrics, I’m confident you’ll be able to make your (bench) mark.

James Clark is a web analyst from London, with a background in the publishing sector. When he isn't helping businesses with their analytics, he's usually writing how-to guides over on his website Technically Product. Twitter | Linkedin