
online store
bookings
events
popup

Charts
By
Easily import, sync, and embed dynamic charts
4.9
Free to install


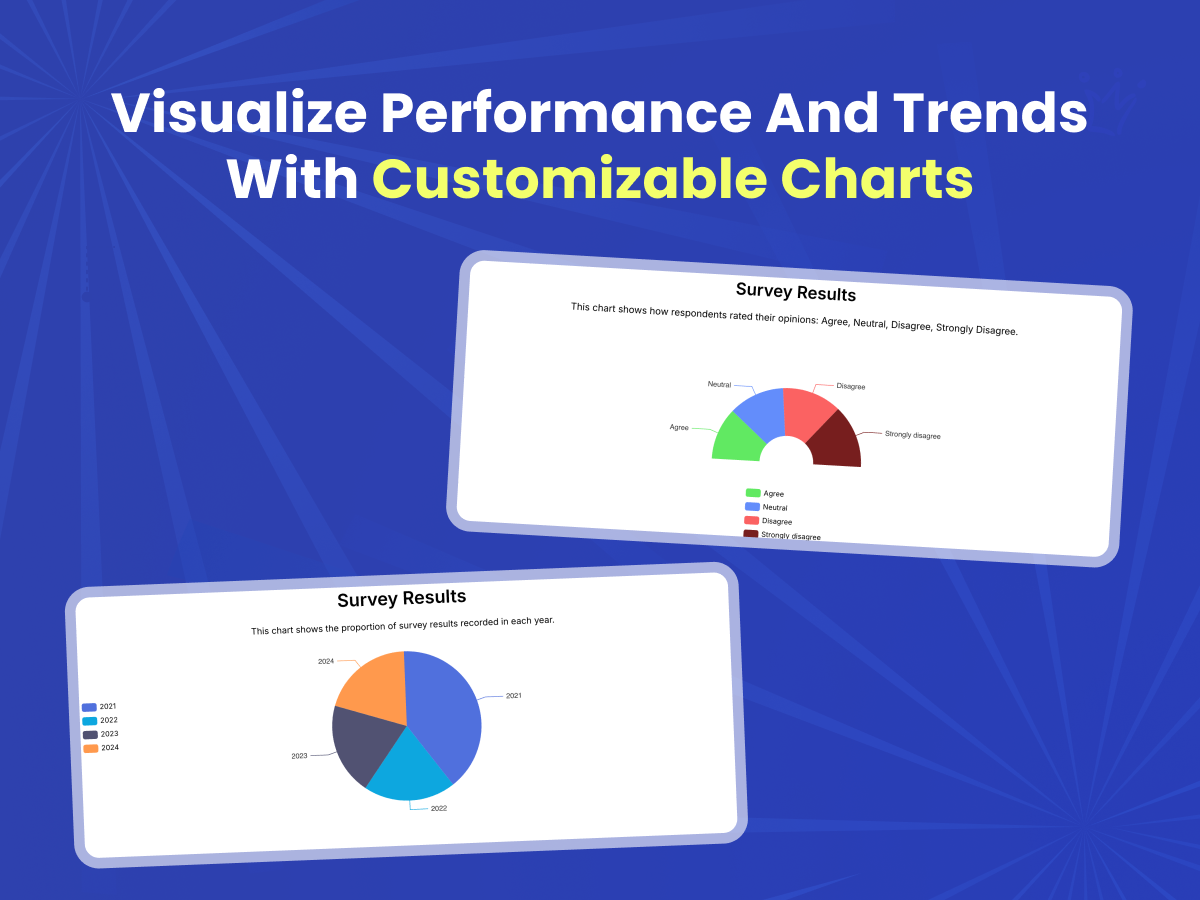
Charts overview
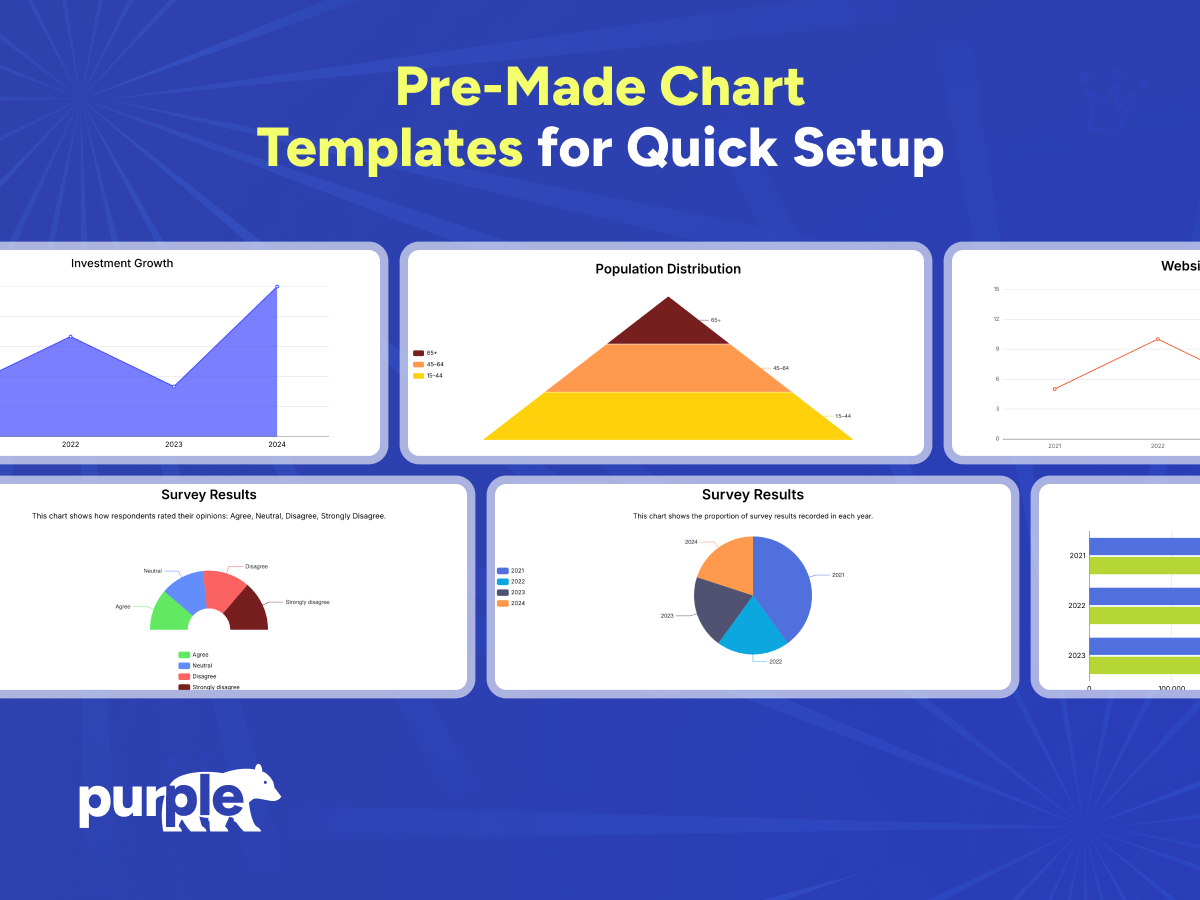
- 16 Chart Types – Create bar, pie, line, donut, radar, and other interactive charts to illustrate any data
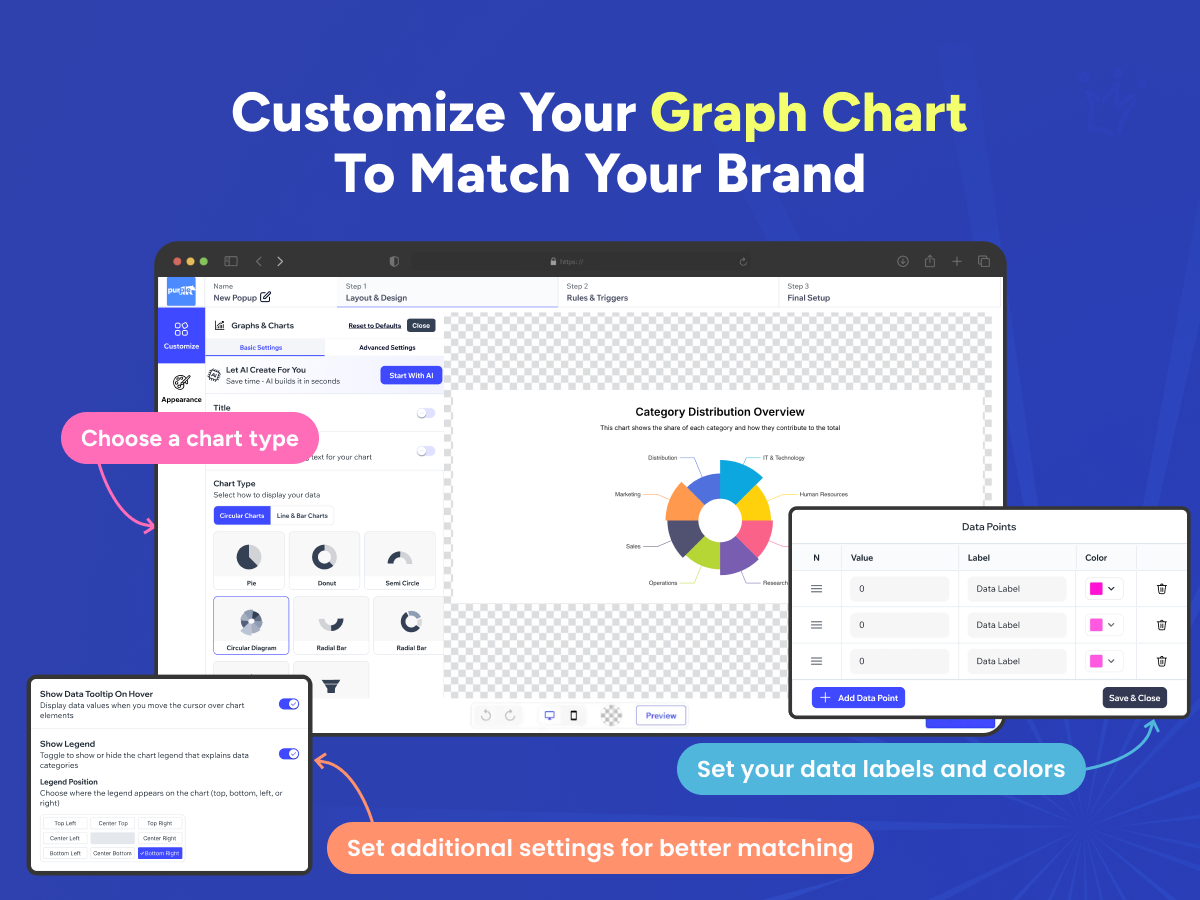
- Full Customization – Personalize colors, fonts, and layouts to align with your brand’s style
- Professional Templates – Use ready-made presets to launch polished charts in seconds
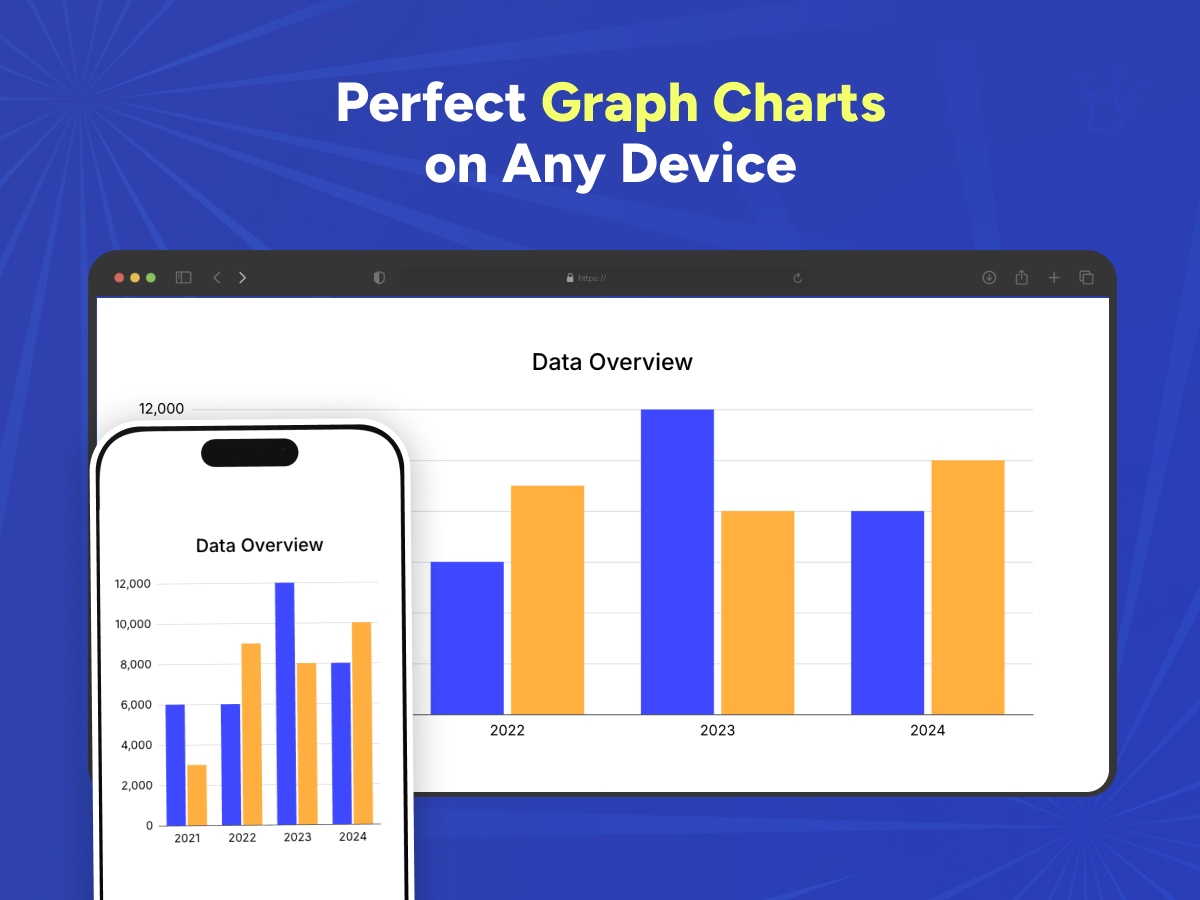
- Embed Anywhere – Add charts to product pages, blogs, landing pages, or promotional sections
Availability:
This app is available worldwide.App languages:
English,
French,
German,
Italian,
Polish,
Portuguese,
Spanish
4.9 Average Rating
7 reviews
5
6
4
1
3
0
2
0
1
0
Sort by:
LO
Loadncode/ Jun 7, 2026
Good
PU
team PurpleBear
Thank you for sharing your thoughts.(0)
Thank you for your feedback
CA
Callumcraig3/ May 17, 2026
Great
PU
team PurpleBear
Thank you for sharing your thoughts.(0)
Thank you for your feedback
DO
Donangus/ May 17, 2026
Loving it so far
PU
team PurpleBear
thank you!(0)
Thank you for your feedback
K1
K18digital/ May 8, 2026
Good so farFound adding the widget fast and smooth
PU
team PurpleBear
Thank You for the review!(0)
Thank you for your feedback
DA
Daruneepiano99/ Apr 28, 2026
ก้ดี
PU
team PurpleBear
Thank you!(0)
Thank you for your feedback
Pricing & plans
Usage based pricing plan
Free to install
Flexible monthly pricing based on usage
3-day free trial
Low-cost pricing starting at $5/month
Styling customization to suit theme
Support & live chat
* The price does not include applicable taxes, which may apply according to your billing address. Additional charges may apply.